Bull Bear Divergence IndicatorThe script is written for Constance Brown-like anayis with divergence signals between price and indicator (i.e. stock close / RSI divergence)
Note: Though the example here with NVDA shows good reversal predictions, best results generally are optained with un-normalized indicators and oscilators like CB#s comosite index.
(For Trading view written by LazyBear.) I use two different lines: an indi high line for baerish, and an indi low line for bullish divergences.
The script only shows divergences to pivot pairs next to each other, not between actual pivot and those "a few pivots ago"
For individual work, chose your indicator and replace rsi in line 10 with it, anything else is auto. Sript bottom: optional comparison lines addable.
Search in scripts for "THE SCRIPT"

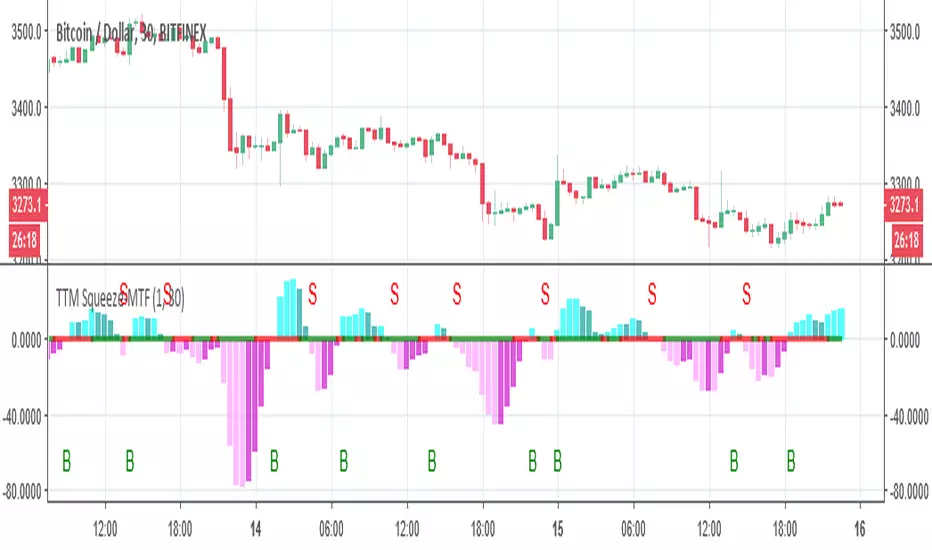
TTM Squeeze-MTFthe script based on
I just change it to be non repainting MTF and add signals
you can change the MTF by changing int2
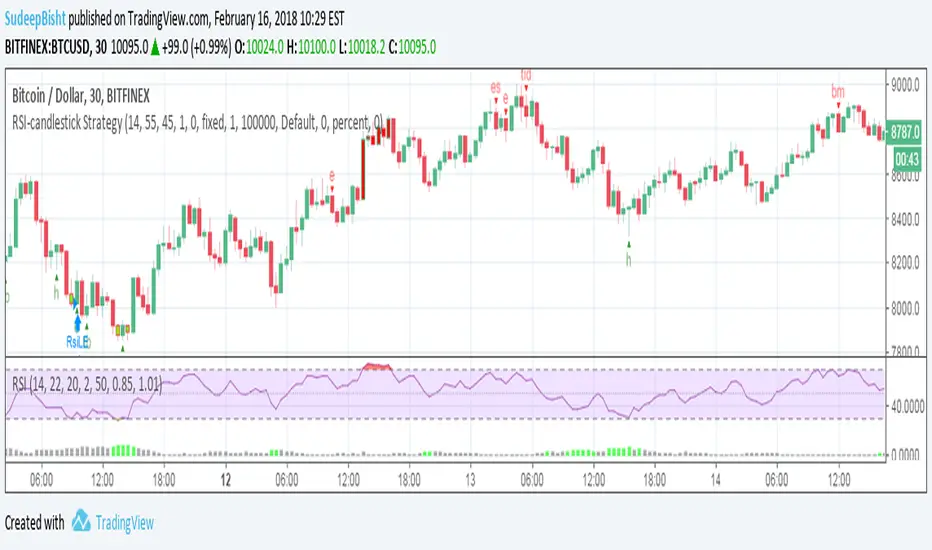
RSI-candlestick StrategyThe script follows a modified rsi strategy and orders are placed if a candlestick pattern is identified in the current or previous candle.
(For optimized results you can add or remove the strategy entry and exits based on the chart you wish to apply the script to).
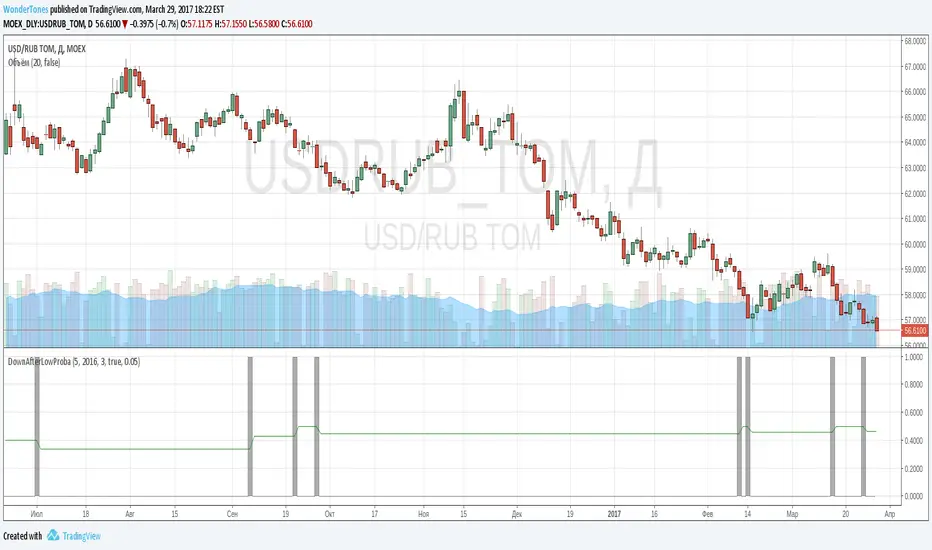
DownAfterLowProba// The script is useful to inspect probability:
// If previous day closed at lowest price for several days
// how often next day would be red bar
// As one can see gray lines indicate bars with lowest close. If next bar is green, increment diff_hi, overwise increment diff_lo
// Probability is counted as diff_lo / (diff_hi+diff_lo)
// One can copy script and change conditions to count other interesting probabilities
3BBands (3 Spirolinas)The script combines 3 single Bollinger bands into one script for easy plotting and range modification. It can be used for analyzing a market with multiple time frames and ranges using Fibonacci series as the range.

Relative Performance ComparisonThe Script was made to compare the performance of the YM and the NQ for a period of time that you can adjust with the lookback period. There is also the possibility to adjust the smoothing of the lines in the graph and you can enable or disable the several visuals. If you wish to compare something different then you could also enter the ticker of the assets that you want to compare.
For YM and NQ the idea is that they have a high correlation and that if one of them is weaker than the other one, the stronger one could have more potential in that direction. Or if for example the weaker one is shifting in sctructure then the stronger one could also shift in structure but has the possibility of more gain as it held stronger through the weakness of the other one.

Ayan EMAV HunterThe script involves 2 zones.
The Blue Zone is the Hunting Zone and the Red Zone helps to decide the which side to trade.
If the Blue Zone is above the Red Zone, we search for UpTrend Trades of 1:2 and we need to observe the candles with the Yellow Arrow which indicates Smart Money entering
Similarly, If the Blue Zone is below the Red Zone, we search for Bearish Trades with 1:2 Risk/Reward and we need to observe the candles with the Yellow Arrow which indicates Smart Money entering
If the Blue Zone lies within the Red Zone, then NO Trade, Just Observe
Please share your feedback if it can be refined

[LCS] Bar HeatmapThe script is an overlay aimed at making price action within a range more comprehensible, i.e. what is the “story” that the band range is telling in relation to the price. You’ll see bars become brighter as they come near the upper or lower band, and dimmer around the average/middle of the two bands. This makes it easier to spot when the price is within an oversold or overbought area or when its experiencing a strong trend movement. The color shift from one to the other can also give a sense as to whether the price action is changing character (going from bullish to bearish or vice versa).
Settings are available for customization to the user's liking.
How to use:
1. Add the indicator.
2. Add another indicator to use as the source, such as Bollinger Bands, which provides upper and lower plots for a channel range.
3. Click the gear icon to access the indicator settings.
4. Mandatory: Select the Upper Band and Lower Band settings as the upper and lower plots from your source indicator of choice to define the range.
5. Save settings. You should now see bars on your chart.
6. Access the Chart Settings (not the indicator settings) and hide the Body, Borders, and Wick for the default candle bars to avoid overlap.
You may need to perform additional configuration steps in your source indicator to appropriately size the range of the upper and lower band plots for a meaningful visualization.

Sessions[Lenny Kiruthu]The script below is designed to show up to 4 different trading sessions i.e. London, New York, Tokyo and Sydney sessions, it also displays the days each session is taking place in as well as two horizontal lines one for the previous days high and the other for the previous days low.
It also displays a table that shows the user the highest and lowest price for 4 different currency pairs the previous day as well as their current prices and below it a confirmation row that shows whether price is currently above, below or within yesterdays range. Note that it only states "High Broken" or "Low Broken" if the current close is above or below the lines.
What you can change
Your time zone for example GMT -4 or GMT +3
The session start and end time
The colors, border type and border width of the session ranges
Displaying the table
Ability to choose the 4 symbols to view on the table

Volatility Trigger IndexThe script allows to assess the volatility of an asset.
It works by calculating the rate of change and the standard deviation.
The index is useful to determine the lowest volatility periods (could be useful to look strategies) and also it determine the highest volatility periods (maybe for exits or partial closes).
It has 3 iputs:
Lenght.
Low volatility value.
High volatility value.
The low and high values are set after a visual inspection. The values changes in each time frame. Usually when the timeframe is higher the value of the index is higher as well. So the low and high levels must be changed after each time frame set.
As an idea could be used in combination with any moving average to determine the market direction and the index used as a trigger.

The DD investThe script tells me when to invest in the stock.
Split ur money into 3 piles. Each must be bigger than the previous one.
Buy with the first pile when the chart touches the middle line (SMA200).
Buy with the second pile when the chart touches the bottom line (lowest price of 200 weeks).
Buy with the third pile when the chart goes significantly below the bottom line (lowest price of 200 weeks).
Watch only the W1 chart (!!!).
Circles on the chart indicate places where you should buy (examples).
Consider selling half of the holding when the chart touches the top line (the highest price of 200 weeks).
Hold the rest much longer then you plan to ;)

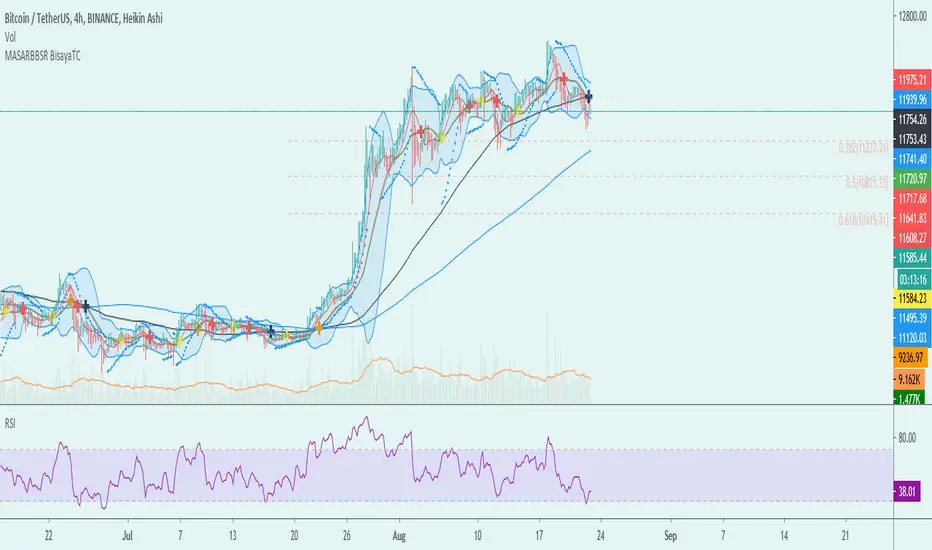
MA-SAR-BB-SR - BisayaTCThe script allows you to use multiple indicators such as Moving Averages, Parabolic SAR, Bollinger Bands, Support and Resistance and it includes alerts for each indicator.
MA - The moving average (MA) is a simple technical analysis tool that smooths out price data by creating a constantly updated average price. The average is taken over a specific period of time, like 10 days, 20 minutes, 30 weeks or any time period the trader chooses.
SAR - The Parabolic SAR is a technical indicator developed by J. Welles Wilder to determine the direction that an asset is moving. The indicator is also referred to as a stop and reverse system, which is abbreviated as SAR. It aims to identify potential reversals in the price movement of traded assets.
BB- Bollinger Bands are envelopes plotted at a standard deviation level above and below a simple moving average of the price. Because the distance of the bands is based on standard deviation, they adjust to volatility swings in the underlying price.
SR - Support and Resistance are certain predetermined levels of the price of a security at which it is thought that the price will tend to stop and reverse. These levels are denoted by multiple touches of price without a breakthrough of the level.
DISCLAIMER: For educational purposes only. Nothing in this content should be interpreted as financial advice or a recommendation to buy or sell any sort of security or investment including all types of crypto. DYOR
3-Daumen-Regel mit 4 Daumen, YTD-Linie, SMA200 und ATR
The script calculates the following values and displays them in a table:
- YTD line
- SMA
- ATR and ATR
- Difference to YTD
- Difference to SMA200
The table also includes a four-point rating for:
- the first 5 trading days of the year
- price relative to SMA
- price relative to YTD line
- the first month of the trading year

Crypto Swing 5% Volatility Scanner (v6)The script is a work in progress and will look for crypto that has a min +-5% Volatility for day trading.

The BLUE Red Candle Swing w AlertsThe script is for high probability swing entries based on a extremely strong bearish candles which typically come right before a green push up.
When a bearish candle has a higher than average ATR, it is a sign that there could be a large reversal coming next.
Use this indicator to help you set the stop loss and take profit based on the range of the highlighted Red candle.
*So if the ATR of this candle is $3.00 then set a $3.00 stop loss and take profit.
There is also a sc
Rules for the ATR RED/Blue Impulse candle
*Use the 50% line or midline of the candle to help refine your entries
*Use the range of the Blue candle as your stop loss range and for your 1st take profit target!
*Add more positions if there is a clear trend after the candle

Top 10 Bullish Wedge ScannerThe script does a check of all stocks and gives the top 10 list of stocks with bullish wedge formed on daily timeframe.

SHFE vs COMEX Silver Spread (USD/ozt)the script shows the gap between shanghai and comex silver prices. they need me to say more words in the description for this in order for me to in order to publish with words. more words.

Volatility Trend FollowerThe script combines several classic technical analysis techniques:
SuperTrend / Adaptive Band - The main idea comes from the SuperTrend indicator, which uses ATR (Average True Range) to create a trailing band that adapts to volatility
ATR (Average True Range) - A volatility measure developed by J. Welles Wilder Jr.
EMA (Exponential Moving Average) - Used as a global trend filter
Heikin Ashi - An option to smooth prices and reduce noise

Algo & Dark Pool Activity - Find Hidden LiquidityThe script is designed to highlight potential algorithmic buying pressure and dark pool accumulation proxies on a TradingView chart. It overlays signals directly on price bars so you can visually spot when unusual activity may be occurring.


XAUUSD Fisher Transform Dashboard — Trend & Momentum InsightsThe script offers an educational visualization of trend and momentum on XAUUSD by combining the Fisher Transform with EMA direction. It plots momentum shifts, trend alignment, and includes a concise dashboard showing trend bias, the latest crossover event, and customizable percentage-based reference markers.
This tool is for market analysis and study purposes only and does not provide trading advice.

Breakout an Reversal Signal Detector with Colored in Bar TrendsThe script detects breakouts and/or reversals: when candles close outside the recent period high or low, it prompts a signal, indicating a change in market trend.
You can customize the bar color to indicate trending phases.
It can be used effectively to identify both breakouts and reversals, making it a versatile tool for trend and reversal analysis.
Simple yet effective.
Enjoy!

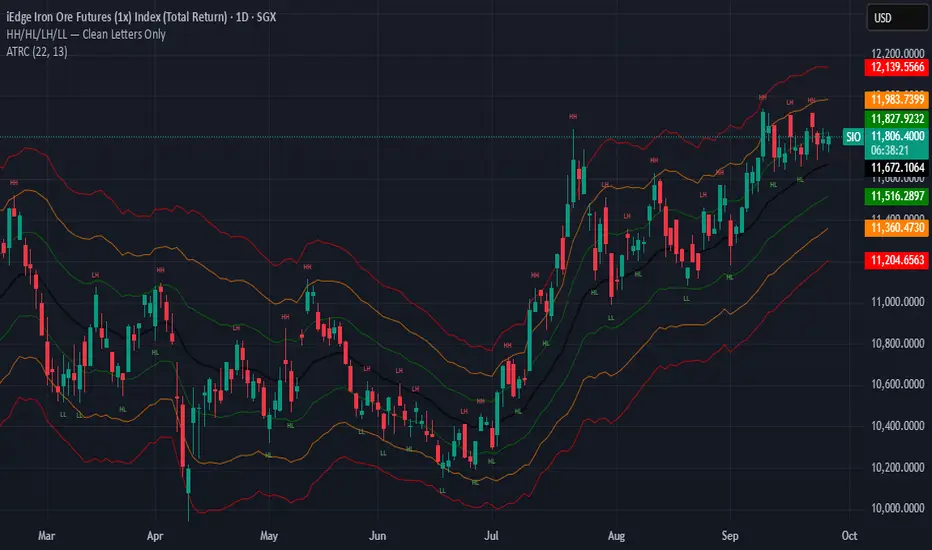
HH/HL/LH/LLThe script works by detecting swing highs and swing lows with a simple pivot function (ta.pivothigh / ta.pivotlow) using a fixed 2-bar lookback and confirmation window. Each new pivot is compared against the previous confirmed pivot of the same type:
If a swing high is greater than the last swing high → it is labelled HH.
If a swing high is lower than the last swing high → it is labelled LH.
If a swing low is greater than the last swing low → it is labelled HL.
If a swing low is lower than the last swing low → it is labelled LL.
To keep the chart clean and readable, the indicator:
Plots only the two-letter labels (HH, HL, LH, LL) with no background box.
Uses red text for highs and green text for lows.
Places labels directly at the pivot bar (with the necessary confirmation offset).
Keeps labels small (size.tiny) to avoid clutter.